The Data Exploration Tool: explore and compare AgMIP results.
What does it do?
The Data Exploration Tool is an interactive multi-dimensional data visualisation tool. Users can
- explore and compare the outcomes of the modelling results for the regional studies,
- and assess adaptation strategies in different scenarios over time.

What data does it contain?
The Data Exploration Tool includes model output data on climate, crops, livestock and economics in the AgMIP study areas.
The study areas included in this prototype version are Nioro (Senegal), Navrongo (Ghana), Nkayi (Zimbabwe), and Bethlehem (South Africa).
How does the tool work?
Step 1
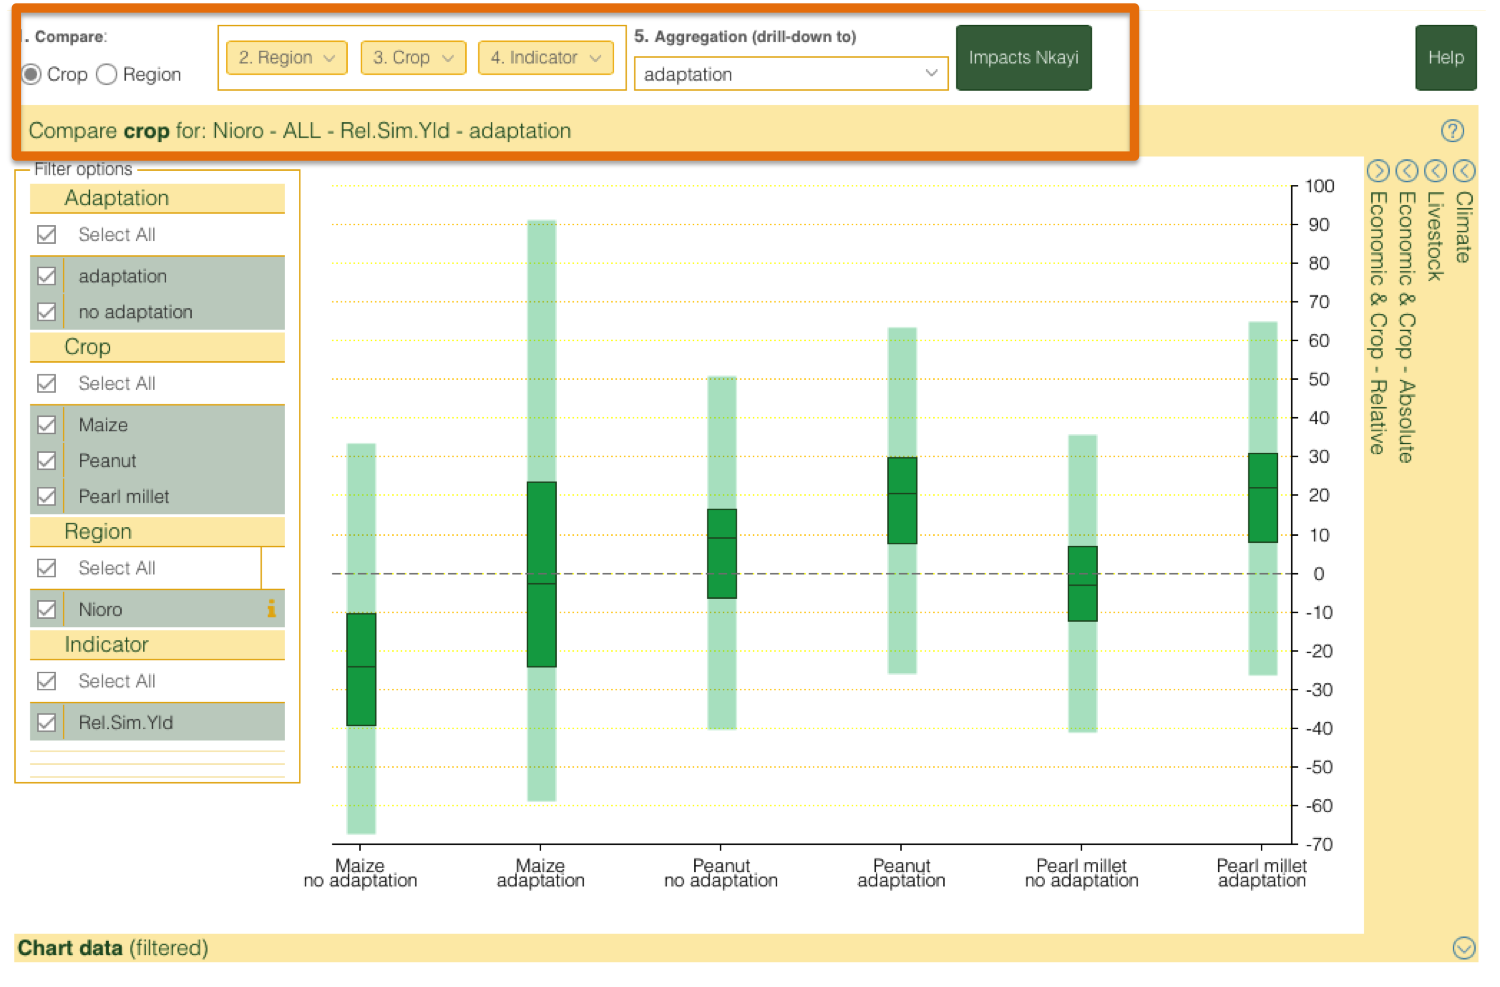
- Select comparison by crop or region
- Select region(s)
- Select crop(s)
- Select indicators
- Select aggregation or detail level
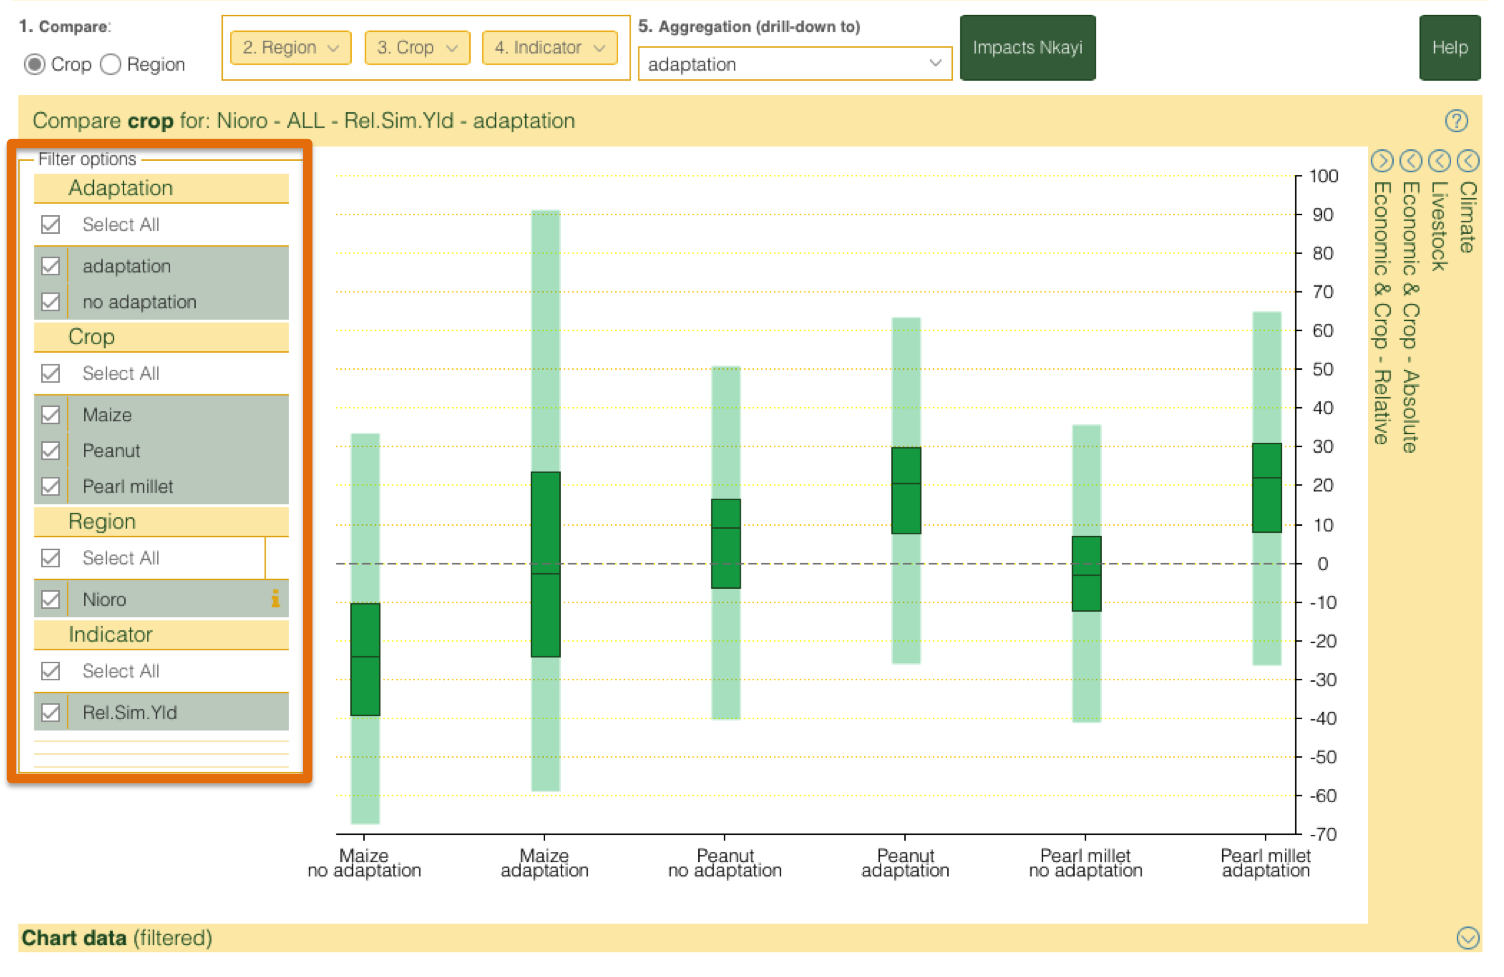
This is a preselection of the data that you can further select or deselect in the menu options on the left hand side of the chart area. The preselection you make is presented in the text bar just below the preselection menu.

Step 2
Select or deselect options to further filter the data shown in the chart area.
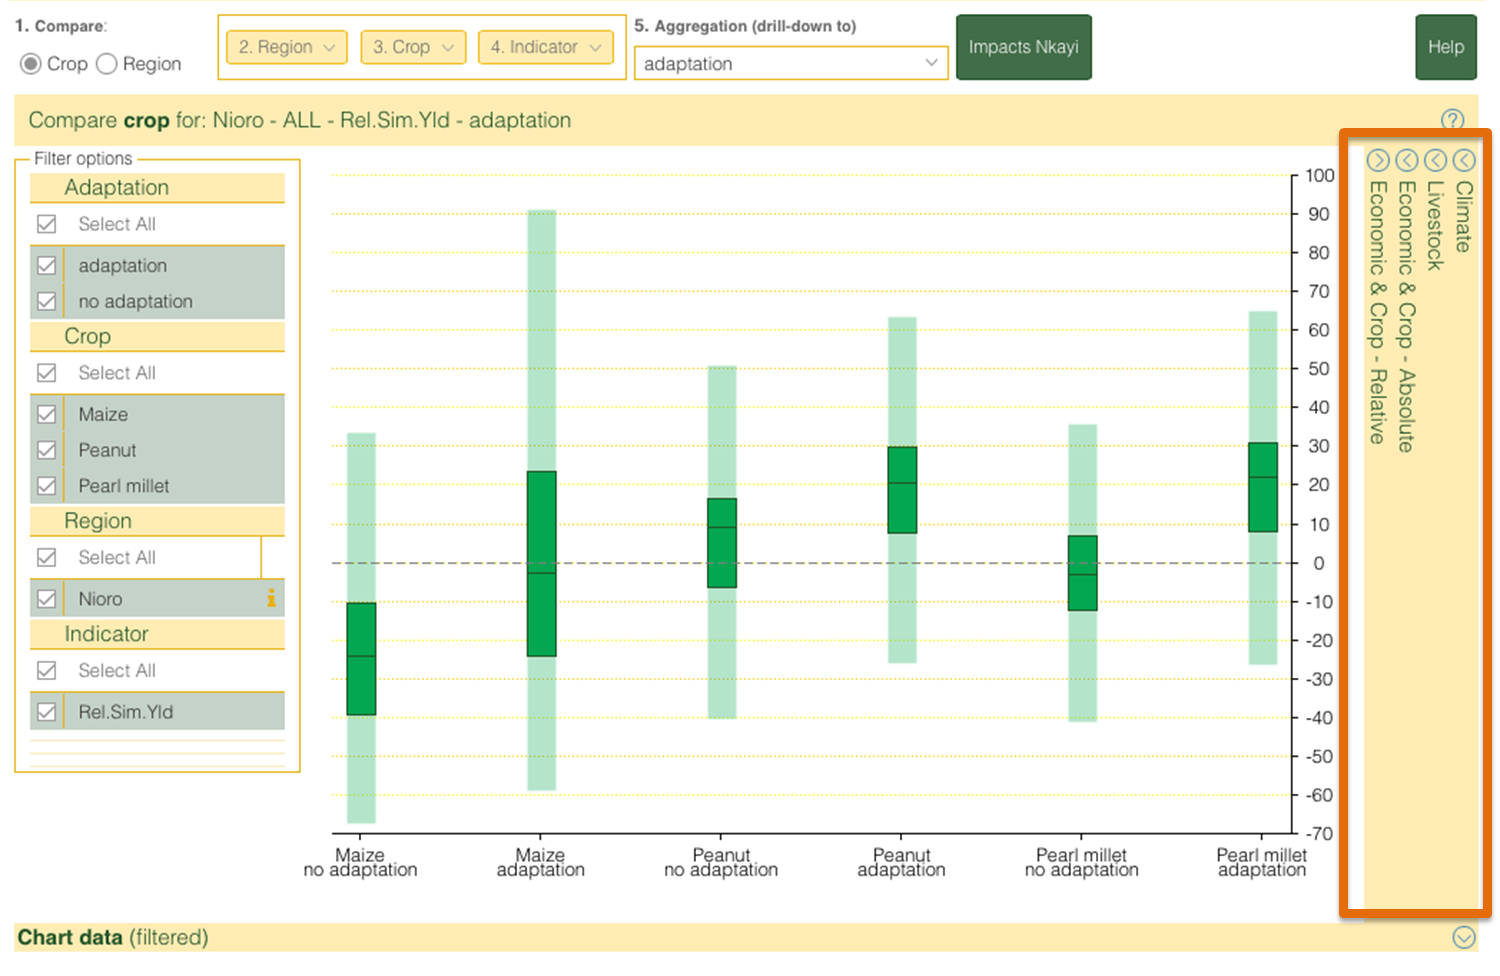
On selection of extra indicators new chart areas open; allowing comparison of data and presenting an overview of available data.

You can make chart areas expand or collapse by clicking the arrow icon in the top of the title bar.

Step 3
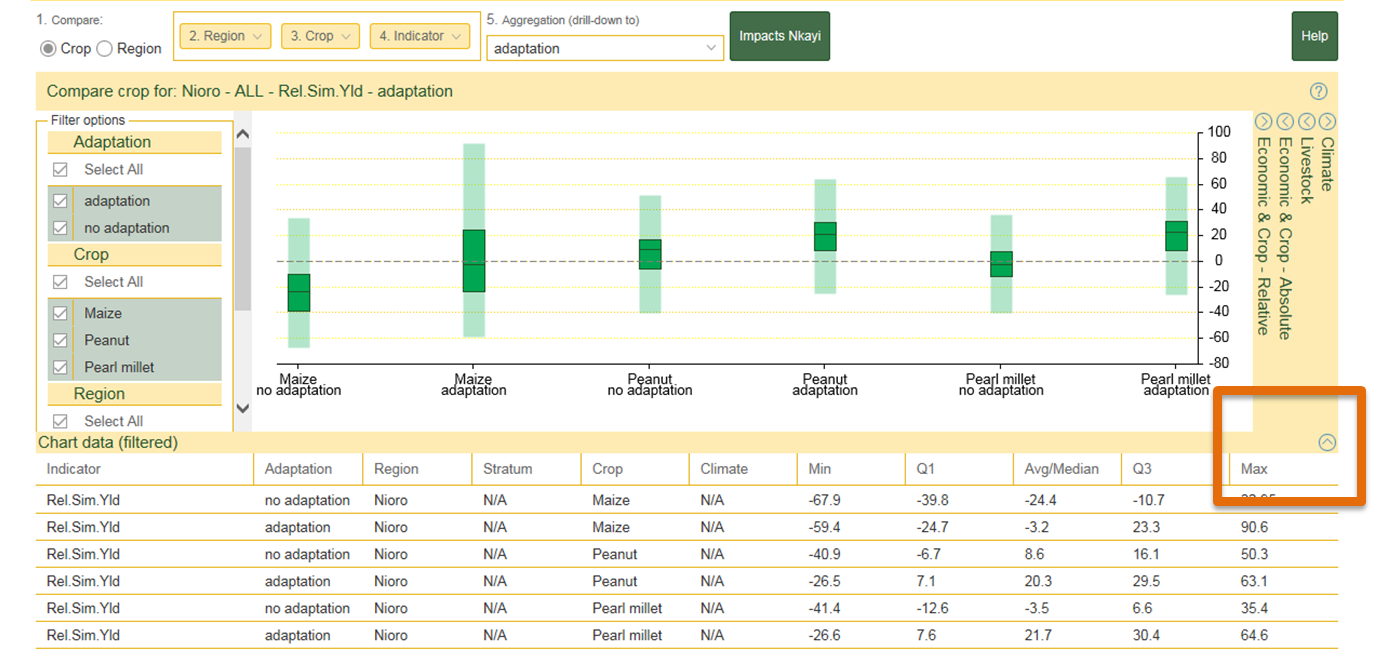
View underlying data by clicking the arrow icon in the bottom right corner.

For an example, click the demo-Impacts Nkayi button
NB: in this prototype version, units are missing. These will be added in the next version.
For questions or comments, contact inge.lariviere -at- wur.nl
